Mobile Web? iPhone, Android, and BlackBerry, mostly.
Here are a few interesting tidbits from some mobile websites we’re monitoring. The following stats are from the two month period inclusive of December, 2010 and January, 2011. The sites are U.S. centric and tend to draw from a younger (18-35 year old) demographic. You can make what you will of this data, I just thought it was interesting to look some actual numbers from working sites.
The data set contains 5,408 unique user agent strings submitted to the mobile sites during the sample period. These UAs are mostly minor variations on a few major device categories, so we’re thankful that the WURFL API collapses similar UAs into the same base device for us. There are also a fair number of weird UAs, as you’ll find whenever you traipse through server logs.
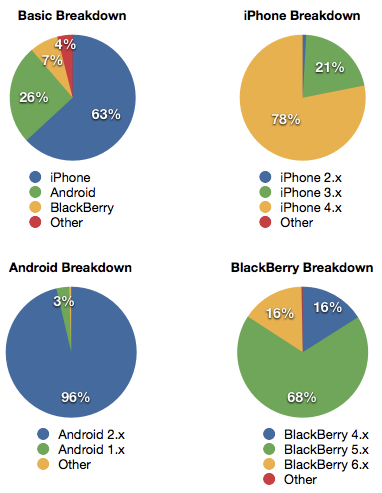
For the approximately 6 million site accesses over this period, 96% of all traffic arrives via iPhone, Android, or BlackBerry. And of those, iPhone dominates site usage with a whopping 63% of all traffic. While 4% of the traffic falls into the “Other” category, that does translate to about 240,000 site accesses from those other guys, so it seems reasonable to care about their experience too. Okay, some of those are bots, so maybe we don’t worry too much about those.
The iPhone traffic is pretty much split between OS 4.x (78%) and OS 3.x (21%), with a tiny smattering of other stuff mixed in. Virtually all Android traffic is coming from Android 2.x devices, though for this purpose I didn’t bother to break it down further than that. BlackBerry traffic is interesting because, while BlackBerry 5.x represents 68% of the traffic, the “older” BlackBerry 4.x devices still represent 16% of all BlackBerry traffic we’re seeing. I put that “older” in quotes because, c’mon, they’re not that old — and we know from experience that some people really love those devices (or are too afraid to let them go). The BlackBerry 6.x devices are also about 16% of all BlackBerry traffic for these sites, which means that 84% of BlackBerry traffic… isn’t.
So, that’s all for now. I don’t have any stunning revelations, but thought someone, somewhere may be wondering about mobile traffic breakdown for some project they’re working on, and perhaps this will help.

